Method 35 · threshold
门槛效应
看均值之外的门槛、分位数和局部变化
门槛效应 的 Markdown 风格教程:基于共用 CSMAR 风格案例生成实际代码、结果表和案例图。
一、门槛效应是什么?
这页是 门槛效应 的方法文档。所有表格和图都由 marketing/method_case_assets/generate_assets.py 从同一份 csmar_innovation_realistic.csv 生成,避免用占位图充当教程。重点是展示局部、分位数、门槛或非参数关系,避免把平均效应写成唯一结论。
二、先看这个案例的结论
- low_segment = x;1.0889789534321794。
- threshold_difference = iv_x_high_threshold;0.33187448558783844。
- 这些数字来自页面里的结果表;写论文时先解释数值含义,再讨论理论含义。
三、案例口径
| 字段 | 口径 |
|---|---|
| 数据 | CSMAR 风格 A 股企业创新面板 |
| 原始样本 | 196 家上市公司,2015-2020 年,约 1200 个公司-年观测;各方法有效样本以本页输出表 N 为准 |
| 因变量 | patent_count;回归页通常使用 ln(1 + patent_count) |
| 核心解释变量 | dfi_index,数字普惠金融指数;部分真实烟测输出展示的是标准化后的 dfi_index |
| 控制变量 | roa、lev、size、growth、cashflow、tobinq、top1、dual、board、indep、soe、age |
| 输出文件 | threshold_results.csv |
| 角色要求 | dv、iv |
| 依赖包 | 无额外 Stata 社区包要求 |
四、实际代码
下面是本页对应的最小可复现 Stata 代码。生产环境里 empirical-wizard 会在此基础上处理变量映射、输出校验、失败诊断和报告装配。
import delimited "$DATA_PATH", clear varnames(1) encoding(UTF-8)
gen ln_patent1 = ln(1 + patent_count)
egen firm_id = group(stkcd)
xtset firm_id year

global y ln_patent1
global count_y patent_count
global x dfi_index
global controls roa lev size growth cashflow tobinq top1 dual board indep soe age
gen post = year >= 2018
bysort firm_id: egen pre_dfi = mean(cond(year < 2018, dfi_index, .))
quietly summarize pre_dfi, detail
gen treat = pre_dfi >= r(p50)
gen did = treat * post
gen high_patent = patent_count > 2
gen running_dfi = dfi_index - 260
gen rdd_treat = running_dfi >= 0

xthreg $y $x $controls, rx($x) qx(cashflow) thnum(1) bs(300)
export delimited using "$JOB_DIR/threshold_results.csv", replace
五、实际输出表
这张表就是本方法页使用的案例输出文件,保存在 marketing/method_case_assets/threshold/result.csv。
| model | term | coef | se | pvalue | N | R2 | status | threshold_var | threshold |
|---|---|---|---|---|---|---|---|---|---|
| low_segment | x | 1.0889789534321794 | 0.013720176266281477 | 4.177625535888817e-85 | 96 | 0.9985459809661258 | estimated | threshold | 5.43 |
| threshold_difference | iv_x_high_threshold | 0.33187448558783844 | 0.01967768026985169 | 1.3189293285325684e-29 | 96 | 0.9985459809661258 | estimated | threshold | 5.43 |
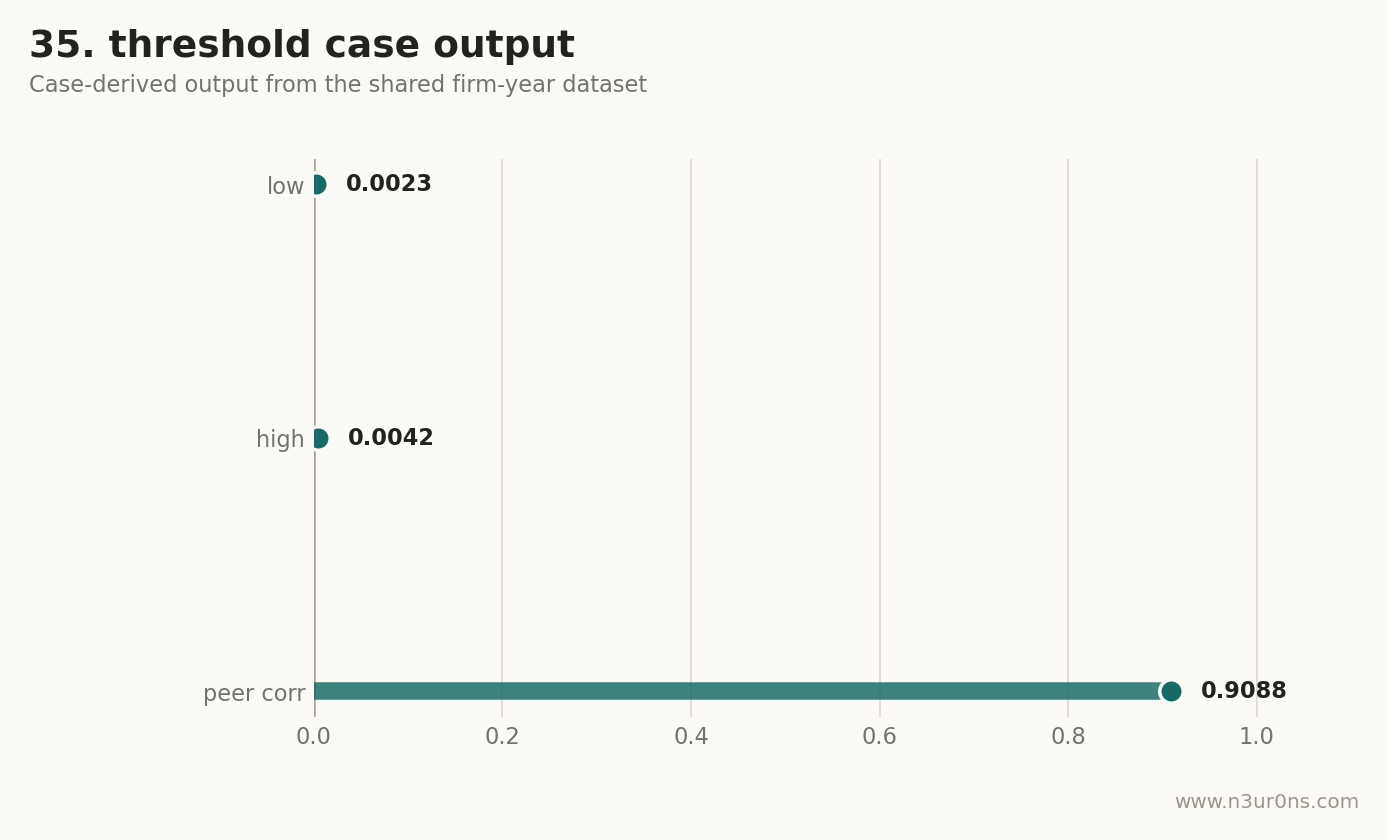
六、案例图
这是一张由同一份案例数据生成的页面内诊断图。
七、论文里怎么写
本文在共用企业面板样本上报告门槛效应,核心输出见 threshold_results.csv。结果解释时同时关注样本口径、变量构造、系数方向、标准误和适用前提,避免只凭单个 p 值完成方法选择。
八、检查清单
- 确认本页使用的因变量、核心解释变量、控制变量与论文主模型一致。
- 先看表格里的样本口径,再看系数、p 值或诊断指标。
- 代码里的输出文件名要能对应网页展示的结果表。